Rob Minto

Sport, data, ideas

Category: Sport (page 3 of 24)

James Anderson’s record highlights England’s weakness

470122776
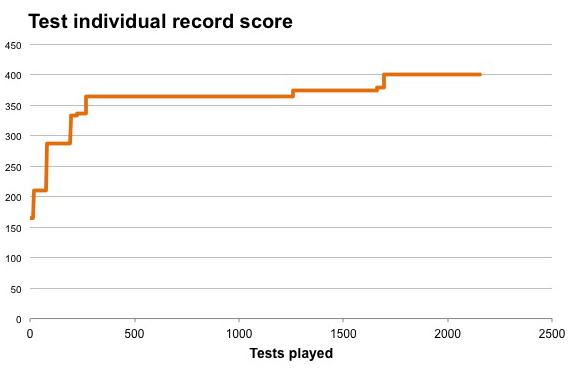
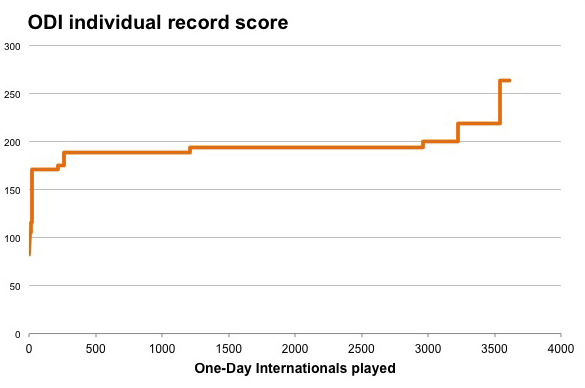
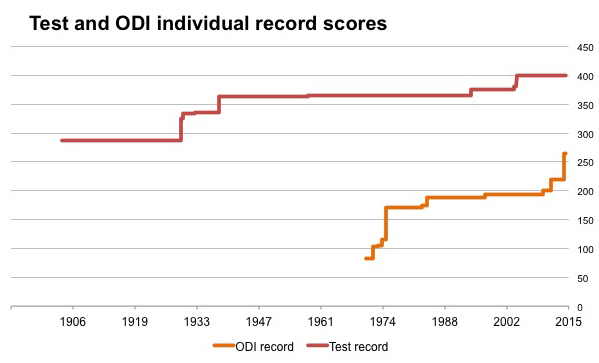
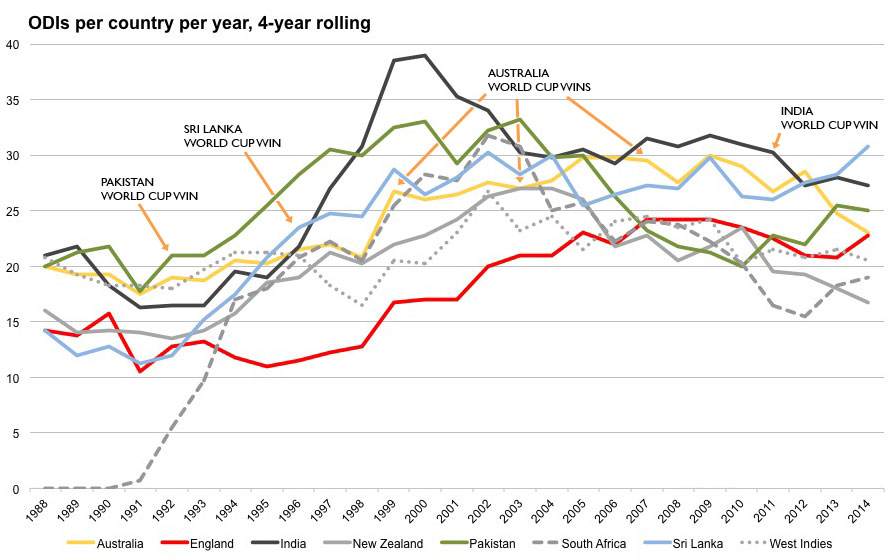
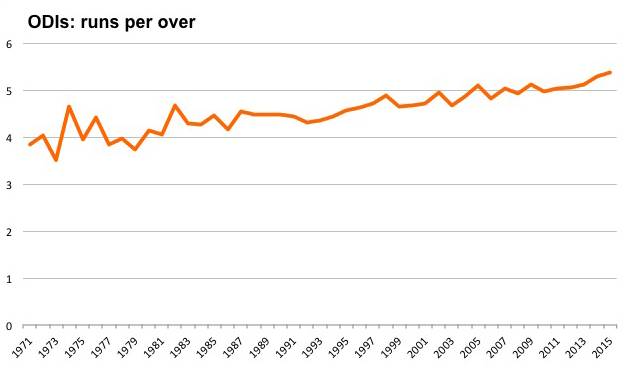
Amid all the articles congratulating James Anderson for surpassing Ian Botham as England’s all-time Test wicket taker, I’ve not seen one to put the numbers in perspective. It’s a fine achievement, certainly, but compared to other countries, it’s pretty small beer.

Just like the centuries record that three years ago fell to Alastair Cook, the England Test wickets record was abnormally low.

For starters, England still is the only major Test nation (bar Zimbabwe and Bangladesh) to have its leading all-time Test wickets record below 400.

Put another way, if Anderson was from India or South Africa, he would be just 4th on that country’s list of all-time wicket-takers. His mark of 384 would put him third in Australia and the West Indies too.

Essentially, Botham’s record has been there for the taking for a long time. England play a lot of Test cricket, so there’s no excuse in terms of matches played. There just hasn’t been a bowler of the class and longevity required to take the record.

Botham was top of the whole world for a while, with a test record that stood for a couple of years. But then the record was pushed up over 400 by two other all rounders, Richard Hadlee and Kapil Dev; and and then 500 by Courtney Walsh.

Subsequently, the two spinners Shane Warne and Muttiah Muralitharan took the record out of sight, over 600, then 700, with Murali on exactly 800 at the end of his career. The all-time list is below the break.

test-wicket-progression-1

Anderson is a fine bowler, but I would be surprised if he gets over 500 wickets when he’s finished. He may well end up around 6th on the all time list if he can stay healthy and get to 450+ wickets. But Dale Steyn of South Africa is ahead of him already, despite playing 22 fewer tests. (A bit old now, but a superb Steyn-Anderson comparison is here that shows how far superior Steyn really is.)

England have not had a world-class consistent bowling attack for a generation. When the team has done well, the bowlers have flourished, but have then faded – such as Steve Harmison and Simon Jones, who had the potential to become a combination as good as any. Great test teams have needed bowlers who work as a unit, and stick around. Anderson has too often carried the attack alone, and while he has earned the record, it is a figure born of hard work and persistence, rather than from blowing teams away.

Continue reading

6 Nations finale: saving the tries to last

467172764
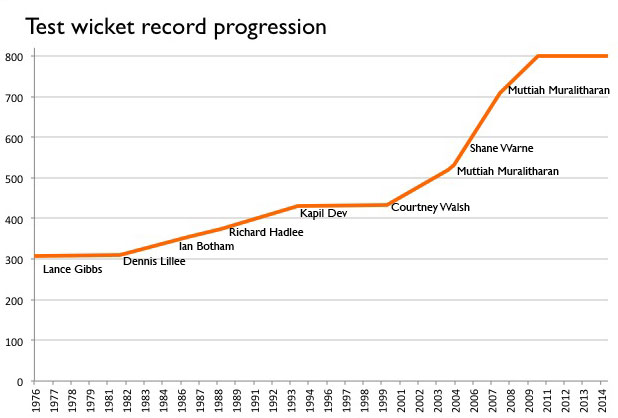
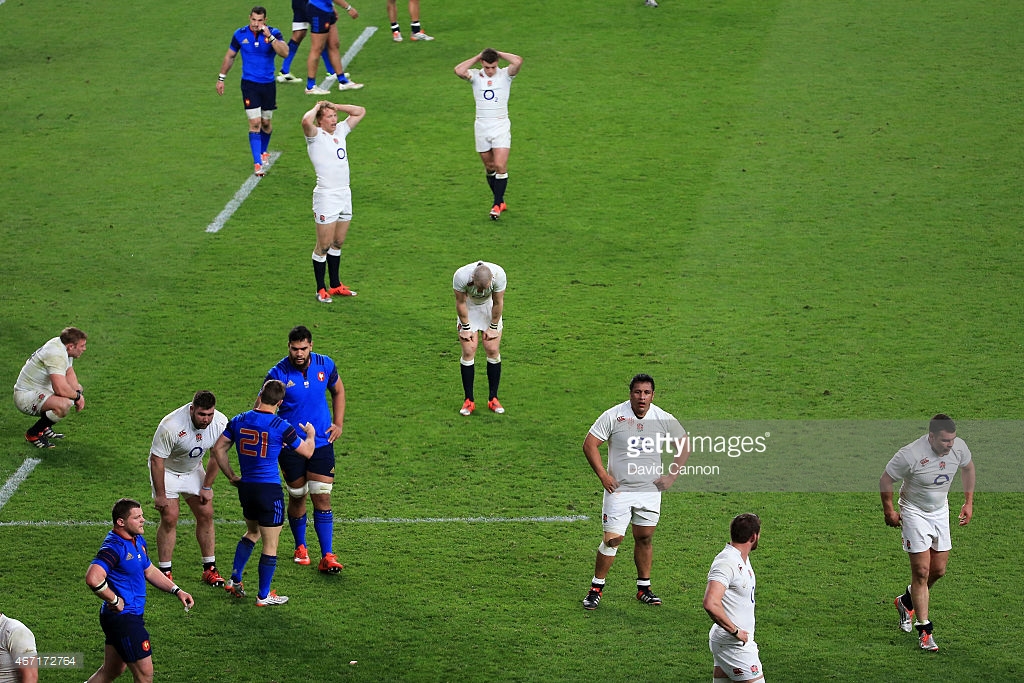
I’m still reeling from the 6 Nations final weekend. I was lucky enough to be at Twickenham, and rugby matches like that are remarkable. But the stats from the weekend are remarkable too.

For starters, the England-France match equalled the highest total number of tries in a 6N match (12) and was the second highest points total with 90. The only match that surpasses it in points (and equals it in tries) is the England-Italy match from 2001, but that was an 81-23 thrashing, mid-tournament.

Part of the reason it the last day was so dramatic was how each team in the previous match had set the bar higher. Wales did their best with eight tries vs Italy; Ireland scored 40 points against Scotland, winning by 30. And so the England-France match was set up perfectly, and it delivered right to the last moment.

And while the numbers can’t convey the excitement, they do back up idea that it was the most dramatic finish ever.

In total, 27 tries were scored on the last day of the 2015 6N. That’s 44 per cent of the tries scored in the whole competition. Compare that to 2012, when just four tries were scored on the last day.

The only other years that come close are 2005, 2007 and 2014, which also saw 20 or more tries on the last day (also all above 30 per cent of the total tries).

6N tries and last round

In those years, the outcome of the tournament was also in the balance on the final weekend. Wales won in 2005, securing the Grand Slam, although France had racked up seven tries against Italy to keep their title hopes alive. In 2007, France scored a last-minute try to take the title over Ireland by just 4 points. And in 2014, Ireland’s narrow 2-point victory over France (again with last-minute drama) gave them the title on points difference over England.

Recent advocates of changing the scoring system to include bonus points might be right in the long run, but with the last two competitions being decided right at the last, it might be a while before anyone signs up to a new set of rules.

Chelsea’s lack of penalties is completely normal – here’s why

466393940
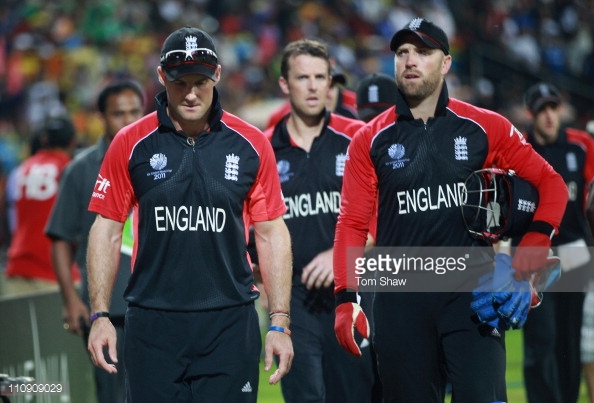
Chelsea took the unusual step of publishing an official moan about their lack of penalties this season. It has been widely reported (Guardian, BBC), but without anyone really taking them to task on the data. But a little statistical digging might have shown that they have nothing to complain about.

The Chelsea article said:

It is in our 28 Premier League games this season where we have been awarded just two penalties. Both were for infringements on the league’s most-fouled player, Eden Hazard, and both were in home London derbies, against Arsenal and QPR respectively. The most recent was four-and-a-half months ago.

Historically, this figure seems abnormally low.

In the Double-winning 2009/10 campaign, when we were the country’s outstanding attacking team, we were awarded 12 league penalties.

So let’s look at the evidence. The numbers that Chelsea point to only look at their own penalties awarded. Statistically, it’s known as sampling bias, but you don’t need to know that to see that it is a bunch of numbers out of context.

What we really care about is a few things: how many penalties should a team expect over a season? Are better teams given more penalties? And how do the league winners compare? The only way to know this is to (with apologies to Peter Moores) look at the data.

Chelsea did indeed get 12 penalties in 2009-10. But this is an outlier – in fact, for all the penalties data I could get from the 1998-99 season onwards, it is the highest number given to one team in a single season.

Two other teams have also been awarded 12 penalties in one campaign. Can you guess which teams they are? Have a go. Other league winners? Nope. In fact, it was Liverpool, in 2013-14 when they finished second; and Crystal Palace, in 2004-05, finishing in 18th place!

That might give a clue as to whether league position and penalties are connected. Basically, they are not. They are very weakly correlated, by a score of -0.28. *

Over a season, the average penalties per team per season has varied between two and six. And in the 16 years of available data, the Premier League winners have had a lower penalty count than the average team five times. That leaves 11 times when it has been higher (see chart below). Yes, you would expect the league winners to play attacking football and get a more penalties than the league average, as Chelsea suggest – but for Chelsea to get less than the average this season is hardly unprecedented.

EPL penalties

Put another way: only four times in the sixteen years of data have the team winning the league also been awarded the most penalties (Arsenal 2001-02, Manchester United 2002-03, 2007-08 and Chelsea 2009-10). Penalties are not some divine right of the best team. History shows that a team can be given a lot of penalties and still finish low down the league. Just ask Palace. Or Sunderland (6 penalties, 14th place last year). Or Blackpool (8 penalties, 19th place in 2010-11). Or West Ham (9 penalties, 17th place in 2009-10).

In other words: Chelsea’s current lack of penalties is nothing strange. It’s just… football.

* A negative number should be expected here, as a better league position is a lower number. For penalties and league position to be correlated, a score closer to -1 would be needed. For those wondering, it is very weakly positively correlated to the points a team gets over a season, with a score of 0.32.

In defence of Moores and data

465665520

It was probably the worst thing he could say. “We’ve got to look at the data” is not a great line for a cricket coach to say to the press after going out of a World Cup.

It’s especially bad when that team has been previously criticised for being over-reliant on data, and sucking the spontaneity out of players.

But let’s be fair to Peter Moores: whatever he had said would not be good enough. The question whenever a country flounders in a big event is: “what went wrong?”. The answer is usually complicated and not necessarily immediately evident. And so the reply is often of the form: “we will try and work it out and learn from it.”

So how do teams work it out? Using anecdotes? Talking to fans? Plucking a theory out of thin air? No, they look at the (whisper it quietly) data.

Of course they do. If looking at data is now taboo, English cricket will suffer. What England need to do is look at the right data, put it in context, and work out what to do next.

But several media commentators have latched on to data as the culprit. We have our new bogeyman, and he is armed with a spreadsheet.

“English cricket kills itself”. That’s the headline in the Spectator. From the piece by Alex Massie:

“We’ve got to look at the data.” If ever there was an appropriate epitaph or this era of English cricket this is it. England have, under Moores, known the price of everything but the value of nothing. The data has given them heaps of information; they’ve had no idea what to do with it.

But why would they? Cricket is a complex game but not a mysterious one. It has changed much less than most people think….

England, however, think there’s some magic sauce that can unlock the mysteries of cricket. So they crunch numbers and discover that x percent of games are won by a score of y or that when z then b and if c then a+b = d. Is it any wonder then they play like humans impersonating robots?

And so on, until this conclusion: “The problem is the bloody data.”

Really? What’s the alternative?

And so the bandwagon starts to roll:

Yet… When articles are written about England’s loss to Bangladesh, they will cite numbers such as:

Between the 21st and 31st overs, only 40 runs were scored for the loss of 3 wickets.

(I just came up with that. I looked at the data.)

Or commentators will look at some other stat which will be seen as where the match was won or lost. That Bangladesh were allowed to plunder 78 off the last 10 overs. That England had them at 32 for 2 after 10 overs, but let a good start get away from them. You can take your pick.

England will have more sophisticated numbers at their disposal, such as what kinds of deliveries produced more dot-balls, or about field placings. Should they ignore them? Simply say it was a “bad day at the office”, or some other sporting cliche?

As the Guardian’s Andy Bull put it recently:

The laptop is just another tool in the box, useless unless the players understand the value of the information it provides, and no more valuable than their own ability to adapt and improvise during a match.

Interestingly, the word that Massie and Bull both use is “value”. If we consign data to a marginal or even zero role, then we will miss valuable insights.

The statistics are there. They lend themselves to being crunched. That’s not a bad thing, per se. Nor is it a good thing. But to say that the numbers are the problem is madness.

AB de Villiers, charted

GettyImages_464587978Who would be a bowler these days? Specifically, who would be a West Indian bowler playing South Africa?

AB de Villiers has done it again: a monstrous innings scored in record quick time. Having set the fastest 100 in just 31 balls in January, he has now set the fastest 150, in just 64 balls.

Clearly, there is room for improvement in the 150 record: he got out on 149 in just 42 balls in the first of these record-setting knocks.

The chart below shows the run accumulation per ball for De Villiers’ innings, and the previous record holders, Corey Anderson of New Zealand who hit 100 in 36 balls (also against the poor West Indies), and Shane Watson of Australia (vs Bangladesh) who got 150 in 83. The red arrow shows the improvement in each record. With just one more run in his first knock, De Villiers could have set the 150 mark far faster, as the orange arrow shows.  (The chart shows run-scoring no balls, which don’t count in the official ball tally).

fastest ODI 100s

What is also amazing is how fast he accelerates towards the end of the innings.

De Villiers is also the holder of the record for the fastest ODI fifty, in 16 balls – scored in the first part of his record-breaking 100. The fastest 50 record is only counted from the start of a batsman’s innings, not part way through.

However, as a comparison, De Villiers scored his last 50 runs in both these recent matches in just 13 balls. That is simply frightening for the opposition bowlers, and a huge boost at the end of the innings for his team. In the World Cup match just gone, South Africa were on course for around 300-320 runs. Thanks to De Villiers, they racked up 78 in the last three overs alone, scored over 400, and won by over 250 runs.

(Stats from Cricinfo)

A Qatar winter World Cup is no bad thing

GettyImages_160425716

Isn’t Fifa simply awful? Having awarded Qatar the 2022 World Cup in less-than-savoury circumstances, now it has the brass neck to move the event to Winter to avoid the scorching heat! Shame.

A quick read of most opinion pages suggests that this is a terrible idea for a clutch of reasons: Europe’s football leagues are thrown into disarray; outdoor screenings won’t work; it will ruin Christmas; the NFL(!) will compete with US attention; it’s a summer event, dammit.

Let’s quickly dismiss a few of the frothier objections: pubs will do fine; it won’t ruin Christmas; do we seriously think the US can only watch one sport at a time? So it is supposed to be a summer event. But having given Qatar the tournament in such a dodgy way, this is hardly the biggest thing to get worked up about.

But how about those European leagues being messed about? Surely there’s something in that?

Well, there are two options. One is to suspend matches while the World Cup is on. The other is to keep playing.

For some reason, only option 1 seems to be the course of action. In which case, La Liga and the Premier League and others will have to start a few weeks early and finish a few weeks late. Hardly the end of the world, is it? The Guardian has put together how the season might look, and, to me, it doesn’t seem too bad.

But what about option 2: play on? That’s what the leagues do during the African Cup of Nations, after all. It is also what county cricket teams do when England play Tests, T20, and One-day Internationals. It’s what the rugby clubs do when the 6 Nations and Autumn internationals are on.

What would the impact be on the leagues? Well, if we take the 2014 World Cup as any guide, the breakdown of players from each league went like this:

League World Cup players
England 119
Italy 81
Germany 78
Spain 64
France 46
Russia 34
Mexico 26
Turkey 26
Portugal 23
Netherlands 20

At first glance, it’s pretty obvious that the leagues that will be most hampered in 2022 are those of England, Italy, Germany and Spain. However, In terms of the overall players, Germany’s World Cup burden is slightly higher than Italy’s, as the league has 18 teams compared to the 20 in the others. If we use the current squad sizes of all the teams in those four leagues, around 21 per cent of the Premiership’s 550-plus players would be off to the World Cup, over 15 per cent of the Bundesliga’s players, just under 15 per cent of Serie A would go, and 12 per cent of La Liga. It’s hardly an entire league – the Premiership would lose one in five players.

But of course, the burden isn’t spread equally around. In 2014 the Premiership had five clubs (Arsenal, Chelsea, Liverpool, Manchester City and Manchester United) with 10 or more players going to the World Cup. All the other teams had 6 or fewer. In other leagues there was a similar skewing: Bayern Munich had 15 World Cup representatives, Barcelona had 13 and Real Madrid had 12. Juventus and Napoli had 12 players in Brazil 2014.

What would the solution be? If the leagues insisted in playing during the World Cup, their biggest clubs would suffer disproportionately. In the era of vastly unequal resources, that might be a rather positive outcome: in the run up to 2022, the bigger clubs would have to expand their squads with home-grown and non-international players; it might mean they become reluctant to sign a World Cup-bound player. However, this isn’t for the entire season – it’s probably for six or seven matches. It would make the league more uncertain, that’s for sure. Smaller teams such as Southampton and West Ham might well vote for it. In fact, put to an equal vote, the majority of Premiership clubs should be in favour of continuing to play during the World Cup.

However, the big clubs are never going to go along with this. For example, Chelsea, with a first team squad of 24 including 12 World Cup players, would struggle to field a team without calling up a host of reserves.

The bigger issue would be gate receipts and advertising. Shorn of the bigger star names, bar the odd exception (such as Gareth Bale), the big European clubs would face a temporary tail-off of interest. It would be a “downgraded product”. And that would never do. Competing head-on with the World Cup would only have one winner: fans want to see the best players in action.

Given that the Premiership seems utterly focused on squeezing every commercial drop it can, the idea of playing on is a non-starter. Which is a shame, as football in England and Spain could do with a rebalancing of power, however temporary.

The only other scenario in which the European leagues would play on is if they force their players to boycott the World Cup. The ramifications of that would be huge. In fact, it would be the most divisive moment in football history, and possibly spell the end of international football in its current form.

Somehow, I don’t think Fifa will let that happen.

How far can cricket’s one-day record go?

The cricket World Cup usually has a pretty dull round of opening matches, but Chris Gayle has done his bit to keep things interesting. His (World Cup record) knock of 215 has been rightly praised and analysed – I won’t go into detail here.

However, it is not the highest One-Day International score ever. And recent cricket records show that 200-plus scores could soon be more common.

Below are the progressive records for the highest Test innings, and highest One-day score.

If we look at the ODI highest-innings record, it charts an interesting course. Unlike the equivalent Test record, which quickly got to over 300 in the 193rd Test in 1930, and then nudged up to 400 over the next 1,500 matches, the ODI record shows the new, go-for-broke batting style of the last few years.

The charts below show the record not by years, but by international matches played. This is a better gauge than the date when the innings was made, as the frequency of cricket matches has accelerated over the years. (Just to illustrate: there were 266 tests played in the 1980s, compared to 420 in the last 10 years. Equally, there were 516 ODIs in the 1980s, compared to 1,385 played in the last 10 years. I have not included the T20 record as it is still early days in that format, internationally at least.)

test indiv record

ODI indiv record

The ODI record starts up towards 200 runs over the first 300 matches or so, and then tails off. Viv Richards’ record of 189 stood from 1984 to 1997, for just under 950 ODIs. Then Saeed Anwar’s record of 194 was the top score from 1997 to 2009, covering over 1,600 ODIs.

But in the last 500 ODIs or so, the record has been pushed over 200 and quickly towards 300.

This is a reflection of new rules – the power plays which restrict fielders on the boundary, as well as a new breed of batsmen who play far more T20 cricket and have pushed the style of the one day format. Players such as Chris Gayle, in fact.

This seems counter-intuitive. The ODI match is restricted to 300 deliveries, whereas the only limit to a test innings is time. However, the Test record has stalled – partly as teams are now keener to push for victories rather than indulge a player who might rack up a huge score, which can often lead to a draw.

So how far can the ODI record go?

Theoretically, a player who hit every ball for 6, except the last ball of the over which is hit for 3 (so he can retain the strike next over) could score 1,653. However, a million ODIs could be played without that happening. More realistically, a player could face around 200 of the deliveries bowled – the current record of 264 by India’s Rohit Sharma was scored in 173 deliveries; the 1975 record of 171 by New Zealander Glenn Turner took 201 balls. If we took Sharma’s strike rate of 1.53 and applied it to 200 balls, that would be a score of 306.

However, a look at the ODI scores of 150-plus shows that higher strike rates are possible. Shane Watson of Australia hit 185 in just 96 balls in 2011. If we applied his strike rate of 1.92 runs per ball to an innings of 200 deliveries, that would result in a score of 380 or so. If we take into account the strike rate of the quickest ODI century – the recent record of just 31 balls was set by South Africa’s AB de Villiers hitting at over 3 runs per ball –  could 400 be feasible?

For that to happen, a lot of things would need to go right: short boundaries; a player of supreme power in luck and in form; poor bowling; and two in three deliveries to that one player. That’s a lot to ask, but the two individual elements (strike rate, number of deliveries) have both been achieved before, so this is not an impossible scenario.

We might even end up with a seemingly unthinkable situation: the ODI innings record higher than the Test mark. Still, a long way to go, as the chart below shows.

test and odi record

England and the ODI fallacy

England lose to Sri Lanka, 2011 World CupEngland don’t play enough one-day cricket to challenge for the World Cup. True?

It was true. It’s not any more, yet it’s a myth that’s still doing the rounds. A recent version comes from retired Sri Lankan spin bowling legend Muttiah Muralitharan. In an interview with the Telegraph, he says:

they [England] don’t play enough one-day internationals abroad like other countries. We play 30-35 one-day matches in a year but England play about 14 or 15, so that is not enough. They play more Tests and that is why they are good in Tests, but they think domestic matches are enough to experience one-day cricket. It is not.

Murali is spot on, if you look at 2012. That year, England played 15 one-day internationals (ODIs) compared to Sri Lanka’s 33.

But that year is something of a blip in the last decade or so. In 2007, England (34) played more ODIs than Sri Lanka (29). It was the same in 2011 – England played 30, Sri Lanka 28. In other years, it’s been Sri Lanka that’s played more, but not by much.

Of course, it was very much the case that England played way too few ODIs to be competitive. In cricket, just as any other sport, results are key. But you also need experience, and simply being less exposed to the 50-over version of international cricket is going to hamper you when it comes to performing at the World Cup.

From 1992 to 2002, England played the fewest ODIs of any of the major cricket sides (I’m not counting Bangladesh or Zimbabwe in this analysis).

Think about this from a player’s point of view. If you had started in the England team in 1992 (and didn’t get dropped or injured), it would have taken you until somewhere in 2004 to get 200 ODI matches under your belt. If you had played for India, your 200th cap would have been in 1999, a full 5 years earlier. India play the most ODIs, so let’s compare to other teams. The next slowest to 200 caps would have been from New Zealand and the West Indies, with their equivalent players getting their 200th cap in 2001, a good 3 years earlier than our English player.

But since 2003, that’s all changed. In the 12 years since 2003, England have played far more one-day cricket, more than South Africa, New Zealand, and the West Indies, and not far behind the others. In that time, an ever-present player would have picked up 273 caps; an Indian player could have accumulated 350 caps. The gap has narrowed.

The four year rolling chart (below, click for full size version) of ODIs played says it all. England scrape along the bottom until 2003, but have picked up since and play a comparable number of ODIs to the other major teams. I have used the rolling four-year chart as the year-by-year version has too many ups and downs to illustrate the trend of matches played. Also, four years is a good time period, as it fits with the World Cup cycle.

ODIs per country, 4-year rolling (annotated)

Of course, the teams that play the most don’t always win the World Cup: Australia have shown that. But in the case of Pakistan, India and Sri Lanka, as well as the 2007 Australians, their World Cup wins came after a four-year cycle of being one of the top two teams in terms of matches played. Experience isn’t everything, but it clearly helps.

3 reasons why the Premier League deal should be no surprise

It looks huge – a $5.1 deal, 70 per cent up on the previous one. The English Premier League certainly knows how to sell itself.

But amid all the mutterings of how the money won’t filter down to the grass roots and smaller clubs, or Alan Sugar’s lovely image of “prune juice”, here are three reasons why we shouldn’t be surprised.

1) Sky

Sky paid £4.2bn for their match packages. Sounds a lot, until you realise that in 2014, Sky made £7.6bn in revenue, and a profit before tax of £1.1bn. Also, this is a three-year deal, so for Sky it works out as £1.4bn per year. In short – the company can clearly afford it. Assuming that the advertisers are still keen, and the public keep subscribing, it could be a great deal.

Of course, the extra money won’t be squandered, from Sky’s point of view. Every big money transfer to the Premier League adds to the allure, so they aren’t just spending money on a fixed asset – they are spending on future improvements too. If English clubs can outspend Spanish rivals, it’s basically free marketing for Sky.

2) BT

BT have become a serious football broadcast player. They snapped up the Champion’s League TV rights, and have again bid up for the Premier League. Increased competition over a fixed supply means higher prices, as any economist will tell you.

3) Lessons of the NFL

It has a bigger domestic audience, obviously, but the NFL has done a very good job of squeezing the broadcasters for cash, with an annualised $5bn-plus deal with several broadcasters over eight years. While this is about double what the British broadcasters are paying (after converting dollars into sterling), there is a remarkable similarity in the increase from the previous deal.

The NFL secured a total $3.1bn TV rights deal for the 2006-13 seasons. That then went up to over $5bn for 2014-21. The Premier League had a £3bn deal for 2013-16, and now £5.1bn for 2016-19. It’s a highly similar increase: 62-plus per cent for the NFL, 70 per cent for the Premier League.

Is it such a surprise that sports broadcasters (albeit in different countries for different sports) have upped their valuation of TV rights by the same amount at a similar time?

It would be nice to see more money going to places other than players’ salaries and agents. But in a commercial world, the Premier League deal is less surprising than the wide-eyed coverage from the media who run every news snippet about football that they possibly can.

ODIs: batsman’s paradise

As the cricket World Cup kicks off, this excellent statistical-based tour of the history of One Day Internationals by Andy Bull of the Guardian is really worth a read.

Best part:

These days the cut-off for a century quick enough to rate a mention in the ODI record books is 79 balls. Any slower than that, and you can’t make Cricinfo’s list, else it’d get so long that they’d have to stretch it to a second page. Wadsworth’s innings doesn’t even come close. As it is there are 91 innings on the list, running chronologically from Zaheer Abbas’ hundred off 76 against Sri Lanka in Lahore, 29 March 1982 through to Ross Taylor’s hundred off 70 against Pakistan at Napier just the other week. Of those 91, 44 have been scored in the last eight years, since the first World T20 in South Africa in September 2007. There have been 946 ODI matches in that time, out of 3,598 overall. So, to put it roughly, the last quarter of ODI fixtures have provided half of all the fastest centuries.

and then later

Of course bowling and fielding have evolved through T20 too. But even with the advances made there, the batsmen are running away with the game. It was 31 years before the average ODI run-rate for a calendar year first crept up above five. First happened in 2005. The median average for the last 18 years (since they first started playing more than 100 ODI games a year) is 4.88. Since the new fielding regulations came in, it has gone from 5.05 to 5.11, to 5.29, to, so far this year, 5.38. It’s leapt up by a full third of a run per over in under three years. Also, in 2013 more hundreds were scored than in any previous year of ODI cricket, the number of balls per six dropped to a record low, and the collective strike rate rose to a record high, crossing 80 for the first time. Then, in 2014, every single one of those records was broken all over again. All this despite the fact that neither year came close to breaking the records for the number of matches played, or balls faced.

Great stuff. But I think it needs a chart, for the run-rate. Here IS that chart (data from Cricinfo):

ODI runs per over

Older posts Newer posts

© 2024 Rob Minto

Theme by Anders NorenUp ↑